Project Completion
(CAT 2021)
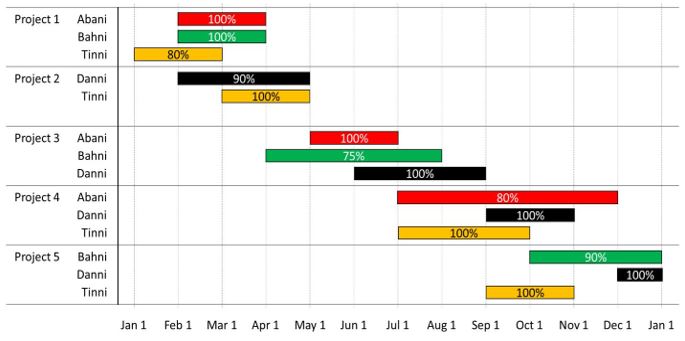
 The figure above shows the schedule of four employees – Abani, Bahni, Danni and Tinni – whom Dhoni supervised in 2020. Altogether there were five projects which started and concluded in 2020 in which they were involved. For each of these projects and for each employee, the starting day was at the beginning of a month and the concluding day was the end of a month, and these are indicated by the left and right end points of the corresponding horizontal bars. The number within each bar indicates the percentage of assigned work completed by the employee for that project, as assessed by Dhoni.
For each employee, his/her total project-month (in 2020) is the sum of the number of months (s)he worked across the five project, while his/her annual completion index is the weightage average of the completion percentage assigned from the different projects, with the weights being the corresponding number of months (s)he worked in these projects. For each project, the total employee-month is the sum of the number of months four employees worked in this project, while its completion index is the weightage average of the completion percentage assigned for the employees who worked in this project, with the weights being the corresponding number of months they worked in this project.
1) Which of the following statements is/are true?
I: The total project-month was the same for the four employees.
II: The total employee-month was the same for the five projects.
- Neither I nor II
- Only II
- Both I and II
- Only I
- Only Abani and Bahni
- All four of them
- Only Tinni
- Only Abani, Bahni and Danni
- Project 3, Project 5
- Project 1, Project 5
- Project 4, Project 5
- Project 3, Project 4
- Danni, Tinni, Bahni, Abani
- Bahni, Abani, Tinni, Danni
- Danni, Tinni, Abani, Bahni
- Tinni, Danni, Abani, Bahni
For answers CLICK HERE.


Comments
Post a Comment