Supply Route
(CAT 2022)
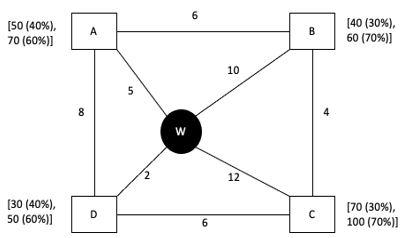
Every day a widget supplier supplies widgets from the warehouse (W) to four locations – Ahmednagar (A), Bikrampore (B), Chitrachak (C), and Deccan Park (D). The daily demand for widgets in each location is uncertain and independent of each other. Demands and corresponding probability values (in parenthesis) are given against each location (A, B, C, and D) in the figure below. For example, there is a 40% chance that the demand in Ahmednagar will be 50 units and a 60% chance that the demand will be 70 units. The lines in the figure connecting the locations and warehouse represent two-way roads connecting those places with the distances (in km) shown beside the line. The distances in both the directions along a road are equal. For example, the road from Ahmednagar to Bikrampore and the road from Bikrampore to Ahmednagar are both 6 km long.

Every day the supplier gets the information about the demand values of the four locations and creates the travel route that starts from the warehouse and ends at a location after visiting all the locations exactly once. While making the route plan, the supplier goes to the locations in decreasing order of demand. If there is a tie for the choice of the next location, the supplier will go to the location closest to the current location. Also, while creating the route, the supplier can either follow the direct path (if available) from one location to another or can take the path via the warehouse. If both paths are available (direct and via warehouse), the supplier will choose the path with minimum distance.
1) If the last location visited is Ahmednagar, then what is the total distance covered in the route (in km)?
2) If the total number of widgets delivered in a day is 250 units, then what is the total distance covered in the route (in km)?
3) What is the chance that the total number of widgets delivered in a day is 260 units and the route ends at Bikrampore?
Every day a widget supplier supplies widgets from the warehouse (W) to four locations – Ahmednagar (A), Bikrampore (B), Chitrachak (C), and Deccan Park (D). The daily demand for widgets in each location is uncertain and independent of each other. Demands and corresponding probability values (in parenthesis) are given against each location (A, B, C, and D) in the figure below. For example, there is a 40% chance that the demand in Ahmednagar will be 50 units and a 60% chance that the demand will be 70 units. The lines in the figure connecting the locations and warehouse represent two-way roads connecting those places with the distances (in km) shown beside the line. The distances in both the directions along a road are equal. For example, the road from Ahmednagar to Bikrampore and the road from Bikrampore to Ahmednagar are both 6 km long.

Every day the supplier gets the information about the demand values of the four locations and creates the travel route that starts from the warehouse and ends at a location after visiting all the locations exactly once. While making the route plan, the supplier goes to the locations in decreasing order of demand. If there is a tie for the choice of the next location, the supplier will go to the location closest to the current location. Also, while creating the route, the supplier can either follow the direct path (if available) from one location to another or can take the path via the warehouse. If both paths are available (direct and via warehouse), the supplier will choose the path with minimum distance.
1) If the last location visited is Ahmednagar, then what is the total distance covered in the route (in km)?
2) If the total number of widgets delivered in a day is 250 units, then what is the total distance covered in the route (in km)?
3) What is the chance that the total number of widgets delivered in a day is 260 units and the route ends at Bikrampore?
- 10.80%
- 33.33%
- 7.56%
- 17.64%
- 3.24%
- 30%
- 5.4%
- 18%
- 210
- 200
- 250
- 220


Comments
Post a Comment